
Across the United States, fewer kids are playing sports each year. Researchers like Tom Farrey want to know why. He’s the founder of the Aspen Institute’s Sports and Society Program, a nonprofit organization that studies youth participation in sports.
About three-quarters of U.S. kids ages 6 to 12 played a sport in 2016, according to the Aspen Institute. This includes team sports like basketball, soccer, and softball. It also includes individual sports like tennis and martial arts.
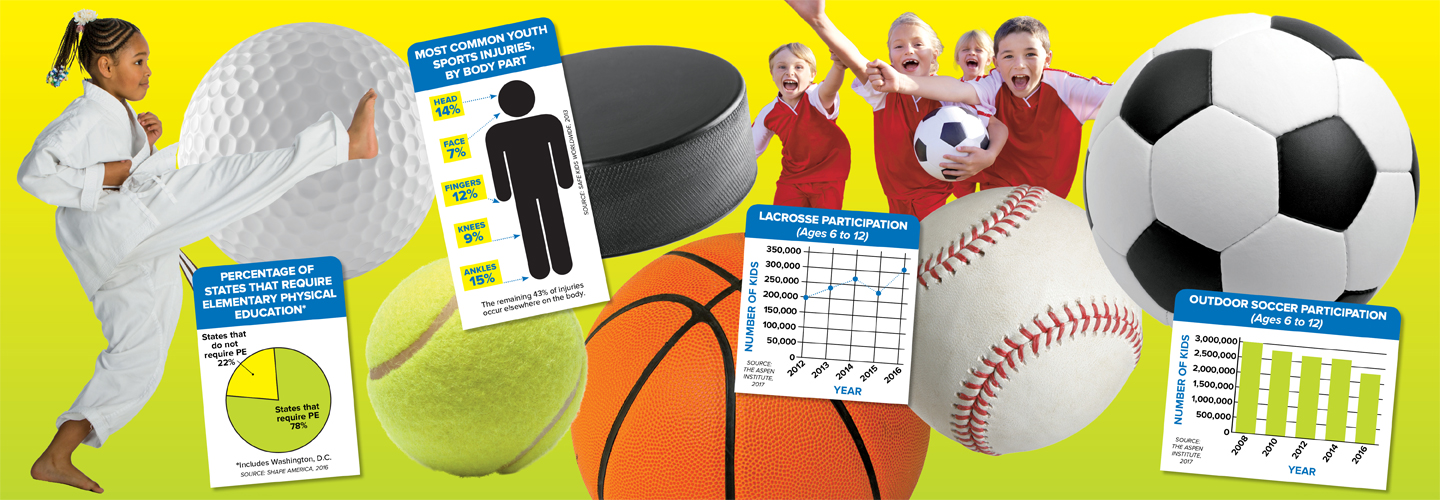
While this seems like a lot, most sports have seen a steady decrease in participation since 2008. Only golf, gymnastics, lacrosse, and ice hockey saw gains during that time.
“There has been a shift away from not only organized sports but also disorganized, casual outdoor play,” says Farrey.
The researchers have a few ideas for why this is happening. One reason is that organized sports teams are expensive to join. Another is that kids are spending more time on their smartphones and tablets, and less time being physically active.
Many organizations are working to address these issues. For example, Major League Baseball offers free baseball and softball lessons to young fans. And most U.S. states require elementary students to take physical education.
Playing sports provides many benefits for kids. Regular physical activity helps keep bones, muscles, and joints healthy—and it also helps stimulate brain function. But that’s not all. Sports provide a sense of community too.
“Sports are just as much about playing with friends as they are about physical activity,” says Farrey.
Fewer kids in the United States are playing sports each year. Tom Farrey wants to know why. Farrey is a researcher at the Aspen Institute, a nonprofit organization. He founded the Sports and Society Program there. His team studies youth participation in sports.
The institute studied U.S. kids ages 6 to 12. In 2016, about three-quarters of those kids played a sport. This includes team sports like basketball and soccer. It also includes individual sports like tennis and martial arts.
That might seem like a lot of athletes. But for most sports, participation has decreased since 2008. Only four sports gained participants: golf, gymnastics, lacrosse, and ice hockey.
“There has been a shift away from not only organized sports but also disorganized, casual outdoor play,” says Farrey.
The researchers have a few ideas for why this is happening. For one, organized sports teams are expensive to join. Kids are also spending more time on their smartphones and tablets. They spend less time getting exercise.
Many organizations are trying to change that. One of them is Major League Baseball. It offers free baseball and softball lessons to young fans. And in most U.S. states, elementary students have to take physical education classes.
Playing sports has many benefits. Staying active helps keep bones, muscles, and joints healthy. It’s also good for the brain. But that’s not all. Sports provide a sense of community too.
“Sports are just as much about playing with friends as they are about physical activity,” says Farrey.